13 July 2022
Canada and the UK also conducted their respective Census in 2021 and have commenced the release of statistics whilst the USA conducted its Census in 2020.
Although some of the statistics will be impacted by COVID-19, there is an opportunity to compare what has happened in various cities in these older countries (and more mature housing markets) over the last decade to gain learnings and trends for Australian cities.
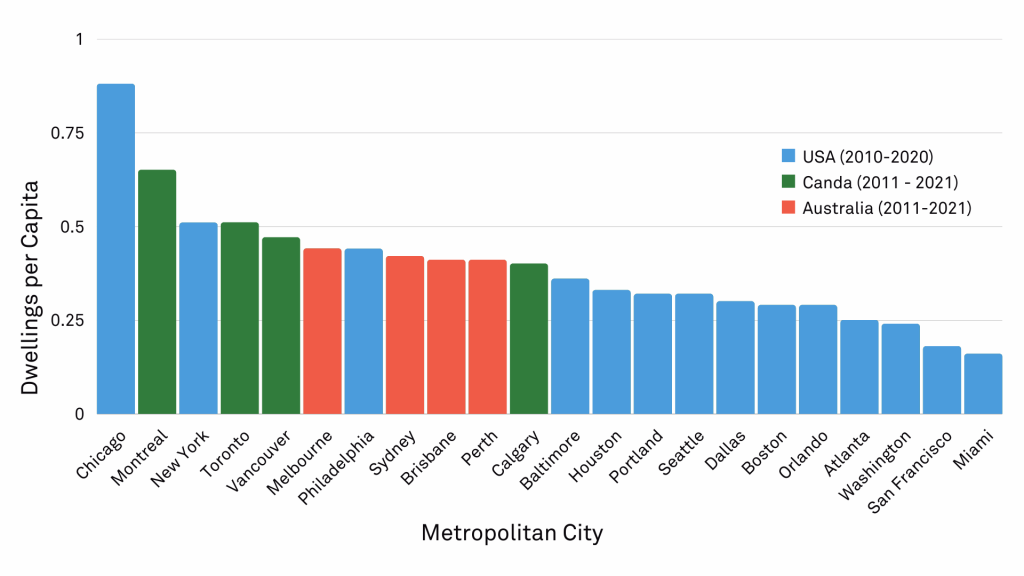
Chart 1 – New dwellings per capita
- It is interesting to compare the total increase in private dwelling stock with the total population increase across various cities between Censuses. A simple metric to assess the relative growth is to calculate the ratio of new dwellings per new person (capita) delivered over the last decade.
- Of the Australian cities, Sydney’s private dwelling stock increased by 353,287 dwellings and the population increased by 839,473 people (0.42 per capita), Melbourne’s private dwelling stock increased by 407,857 dwellings and the population increased by 917,768 people (0.44 per capita), Brisbane’s private dwelling stock increased by 187,568 dwellings and the population increased by 460,242 people (0.41 per capita) and Perth’s private dwelling stock increased by 157,995 dwellings and the population increased by 387,780 people (0.41 per capita).
- By way of contrast, of the Canadian cities, Toronto’s private dwelling stock increased by 314,746 dwellings and the population increased by 619,161 people (0.51 per capita), Vancouver’s private dwelling stock increased by 154,967 dwellings and the population increased by 329,497 people (0.47 per capita), Montreal’s private dwelling stock increased by 233,053 dwellings and the population increased by 357,654 people (0.65 per capita) and Calgary’s private dwelling stock increased by 106,062 dwellings and the population increased by 266,967 people (0.4 per capita).
- Several cities in both Australia and Canada are suffering major housing affordability problems. Some of this could be alleviated through delivering more dwellings to accommodate the rapidly growing populations. As it stands, Australian cities are likely to experience greater affordability issues given they are building fewer dwellings per person than their Canadian counterparts.
Dwellings per Capita
NOTE: The UK Census 2021 statistics for dwellings have yet to be released.
Source: ABS, Statistics Canada, US Census Bureau, Charter Keck Cramer
Chart 2 – Maturity of apartment markets in Australian cities
- It is also interesting to compare the relative maturity of the apartment markets in Australian cities to those in Canada, the USA and the UK.
- The apartment* markets of Australian cities remain comparatively immature by way of comparison to many of these overseas cities. Part of this explanation is the key role the greenfield (house and land) markets play in Australia however there is a noticeable trend towards higher density living which reflects a structural change in living preferences across Australia.
- Between 2011-2021, the percentage of dwellings in the form of apartments in Sydney increased from 10.2% to 16.7%, in Melbourne apartments increased from 3.3% to 7.7%, in Brisbane apartments increased from 2.9% to 6.8% and in Perth apartments increased from 2% to 3.3%.
- By way of comparison, between 2011-2021, the percentage of dwellings in the form of apartments in Toronto increased from 27.4% to 30.7% whilst in Vancouver apartments increased from 14.5% to 18.9%. Furthermore, in cities in the USA of similar population sizes to Australian cities such as San Francisco apartments increased from 16.4% to 18.1% and in Seattle apartments increased from 13.8% to 17.4%.
There is a large and important role for apartments (both Build to Sell and also now Build to Rent) to play in accommodating the growing populations of Australian cities. Given the increase in house prices and the structural change in living preferences (trending towards both higher density living and also longer term renting) it is anticipated that the role of apartments will become entrenched and pronounced over the next decade. This presents significant opportunities for developers and investors who take a longer-term view of this segment of the housing market.
Apartment Market Maturity
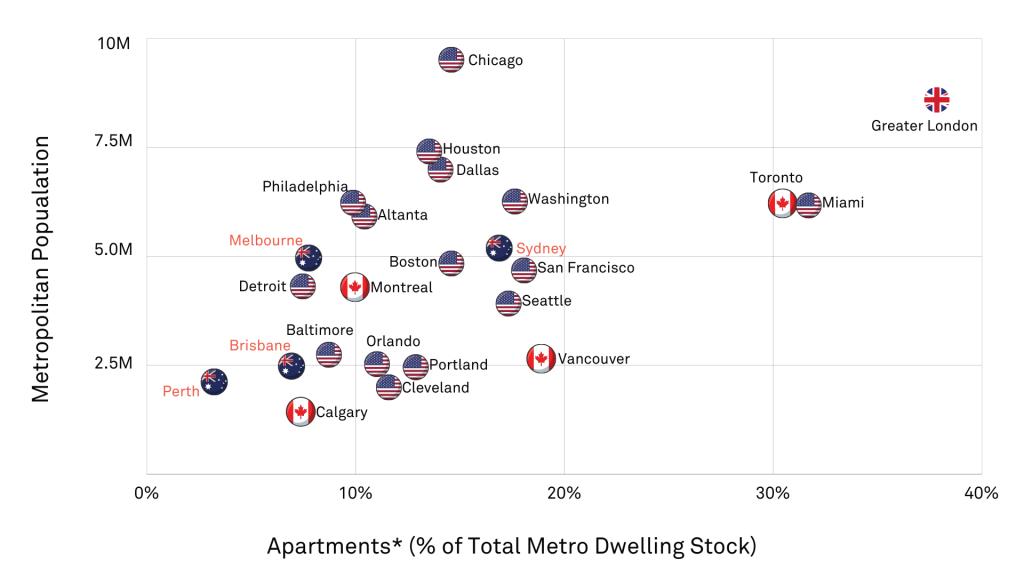
*NOTE: Apartments defined as follows: Australia – flat or apartment in four or more storey block, Canada – apartment in building that has 5 or more storeys, USA buildings with 20+ units and UK – flat, maisonette or apartment in purpose-built block of flats.
Source: ABS, Statistics Canada, US Census Bureau, Office for National Statistics (UK), Charter Keck Cramer